
Quick answer
In GA4, which costs £0, a user is a person (strictly, a browser or device), a session is one visit, and page views count every page loaded. One customer who visits twice and reads five pages counts as 1 user, 2 sessions and 5 page views. Judge the site on enquiries, not totals.
This guide defines each number in plain English, shows how they relate with a worked example, explains why your reports never quite agree, and points out the few figures that matter for a small business.
Why the words get muddled
Website owners hear “we had 3,000 visitors last month” from one person and “3,000 sessions” from another, and assume they mean the same thing. Web designers, SEO agencies and analytics tools all use slightly different words, and older tools used different definitions from today’s Google Analytics 4. Before you compare any two numbers, you need to know which one each report is actually counting.
The definitions below follow GA4, because it is the tool most UK small business websites have installed.
The core numbers, defined
| Term | What it counts | Plain English |
|---|---|---|
| Total users | Unique users who triggered any event in the date range | Roughly, different people who visited |
| Active users | Unique users who engaged with the site | People who did more than glance and leave |
| New users | Users whose first-ever visit fell in the date range | First-timers |
| Sessions | Periods of time a user interacts with the site | Visits |
| Engaged sessions | Sessions over 10 seconds, with a key event, or with 2+ page views | Visits where something happened |
| Views (page views) | Every page or screen loaded | Pages read, including repeats |
| Engagement rate | Engaged sessions as a share of all sessions | How many visits were real |
| Bounce rate | Sessions that were not engaged, as a percentage | The opposite of engagement rate |
The user definitions come from Google’s help page on user metrics, and the engagement rules from its page on engagement rate and bounce rate.
What a session really is
Google’s session help page defines a session as a period of time during which a user interacts with your website. By default, a session ends after 30 minutes of inactivity.
That timeout explains a lot of odd numbers. If a customer opens your quote page, goes to make a cup of tea, takes a phone call and comes back 40 minutes later, GA4 counts two sessions from one person. If they read six pages in a row without a long pause, it is one session.
The session also carries the source of the visit: Google search, an ad, Facebook, an email link or someone typing your address. That is why “sessions by source” is one of the most useful reports for a small business.
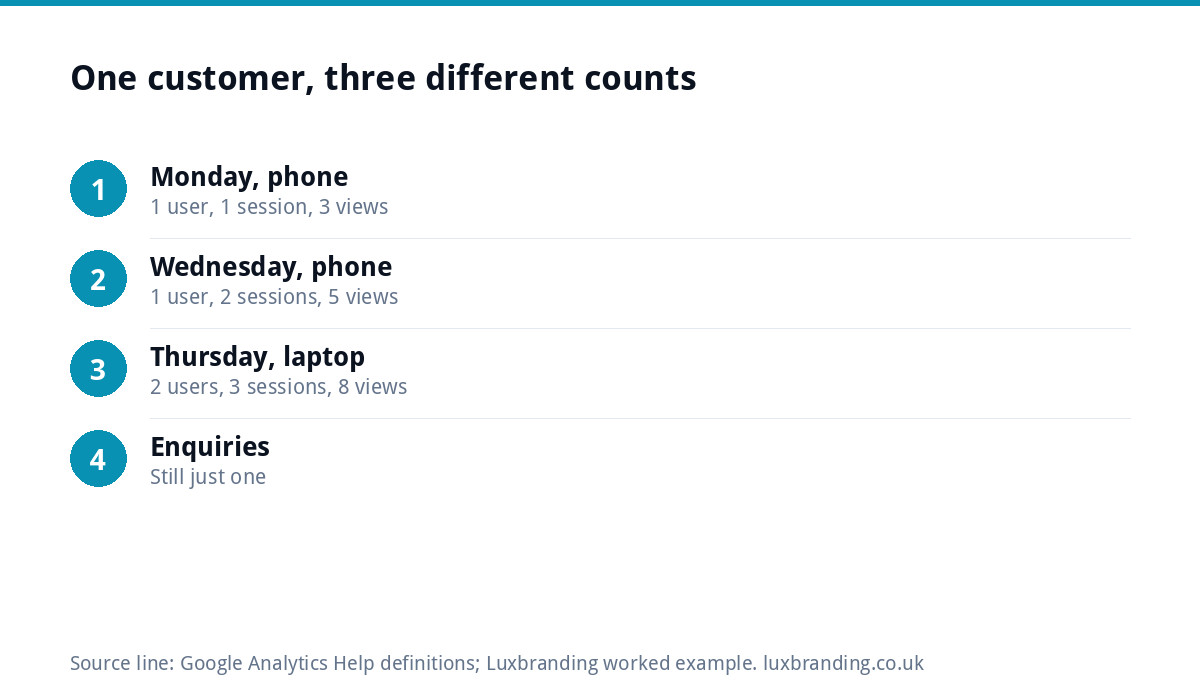
A worked example: one customer, three numbers
Imagine a homeowner in Derby looking for a kitchen fitter.
- Monday evening on her phone: she finds you on Google, reads the home page and two project pages, then leaves. That is 1 user, 1 session and 3 page views.
- Wednesday on the same phone: she comes back from your Instagram bio, looks at the gallery and the contact page, and sends an enquiry. Still 1 user, now 2 sessions and 5 page views.
- Thursday on her laptop: she shows her partner your site. GA4 usually cannot tell this is the same person, so it now reports 2 users, 3 sessions and maybe 8 page views.
One real customer, one enquiry, and depending on which number you read, the “traffic” is 2, 3 or 8. This is why chasing the totals is misleading, and why enquiries are the figure that matters.
Other words you will hear
Reports from agencies, hosts and older tools use a few more terms. Here is how they map onto the GA4 numbers above.
- Traffic. A loose, everyday word. It can mean users, sessions or page views depending on who says it. Always ask which.
- Visits. Almost always sessions.
- Unique visitors. An older name for users, still used by many hosting control panels. Their definition of “unique” may differ from GA4’s.
- Hits. A very old measure that counted every file requested from the server, including each image and script. One page view could produce dozens of hits. If someone quotes hits, treat the number as meaningless for marketing.
- Impressions. In Search Console and Google Ads, the number of times your page or ad appeared in results. Nobody has visited yet.
- Clicks. The number of times someone clicked through from Google results or an ad. Usually a little higher than the sessions those clicks create, because some people leave before the page loads.
When a report shows a big, impressive number, check which of these it is. A monthly SEO report leading with impressions or hits rather than enquiries is telling you very little about whether the website is earning its keep.
Why your numbers never quite agree
Every owner eventually notices that GA4, Search Console, their hosting panel and their web designer’s report all show different figures. Common reasons:
- Cookie consent. Visitors who decline cookies are often not counted by GA4, so it undercounts. Server logs count everyone.
- Bots. Hosting statistics and server logs include crawlers and automated traffic that analytics tools filter out.
- Devices and browsers. One person on a phone and a laptop counts as two users. Clearing cookies creates a “new” user.
- Clicks vs sessions. Search Console counts clicks from Google search results, while GA4 counts sessions from every source.
- Your own visits. If you and your staff check the site daily and are not excluded, you inflate every number.
- Date ranges and time zones. A report set to US time can shift numbers between days.
None of these means a tool is broken. Pick one source for each question and compare it only with itself, month against month.
The numbers that matter for a small business
| Number | Useful for | Watch out for |
|---|---|---|
| Enquiries, calls and sales | The only true measure of a working site | Make sure forms and call links are tracked as key events |
| Sessions by source | Seeing which channels bring visits | Ads and social can bring volume with few enquiries |
| Engagement rate | Spotting pages that lose people | Low on contact pages is normal once someone has called |
| Top landing pages | Knowing where people arrive | Old blog posts can dominate without bringing work |
| Total users | A rough sense of reach over time | Inflated by multiple devices and cleared cookies |
For an online shop, add the drop-off between product views, baskets and purchases. Our guide to a store with traffic but no sales shows how to read that funnel.
Bounce rate is not what it used to be
If you remember bounce rate from the older Universal Analytics, forget the old benchmarks. In GA4, bounce rate is simply the share of sessions that were not engaged: under 10 seconds, no key event and only one page. A visitor who lands on your contact page, reads your phone number for a minute and rings you is an engaged session, not a bounce.
A high bounce rate on a blog post that answers a quick question can be perfectly fine. A high bounce rate on a service page that should lead to an enquiry is worth investigating.
A simple monthly routine
- Write down enquiries, calls and sales for the month, from your inbox and phone as well as analytics.
- Check sessions by source against the same month last year, not just last month, to allow for seasons.
- Look at the top five landing pages and their engagement rate.
- Note anything unusual, such as a big change in one source, and check it is not a tracking fault.
- Pick one page to improve before next month.
Keep the notes in one simple spreadsheet, one row per month. After a year you will have something far more useful than any dashboard: a record of what you changed and what happened to enquiries afterwards.
If numbers fall sharply, our guide to sudden traffic drops walks through the likely causes, and if the site barely appears in search at all, start with why a website is not showing on Google.
Getting help reading the numbers
If you would rather someone else turned the numbers into actions, our SEO service is £249 a month and includes monthly reports that lead with enquiries, not vanity totals. For a quick snapshot of where your site stands, try our free SEO audit, and our guide to what SEO costs in the UK explains the options. Every price is on our pricing page.
Get the UK SEO DIY Audit Checklist (free)
A 32-point checklist UK SMEs can run against their own website in an afternoon. Surfaces the quick wins before paying for a paid audit.
No spam. UK GDPR compliant. We only use your email to send this resource, unless you tick the box to hear from us.
Frequently asked questions
What is the difference between users and sessions? +
A user is a person, or strictly a browser or device, and a session is one visit. One person can create many sessions: in GA4 a session ends after 30 minutes of inactivity by default, so someone who returns later the same day, or another day, adds a session without adding a user.
Is a page view the same as a visit? +
No. A visit is a session, while page views count every page loaded during it. A visitor who reads your home page, two project pages and your contact page creates one session and four page views. Refreshing a page or going back to it also adds page views.
Why does GA4 show fewer visitors than my hosting stats? +
Hosting statistics usually count every request, including search engine crawlers and other bots, and they see visitors who declined cookies. GA4 filters known bots and often cannot count people who refuse consent. Neither is wrong; they measure different things. Compare each source only with itself over time.
What is a good engagement rate? +
There is no single good figure, because it depends on the page. In GA4 an engaged session lasts over 10 seconds, includes a key event or has two or more page views. Service pages that should lead to enquiries deserve attention if engagement is low, while quick-answer blog posts can be fine with less.
Can Luxbranding report on my website numbers? +
Yes. Our SEO service is £249 a month and includes monthly reports that lead with enquiries and sources rather than vanity totals, along with work on rankings, content and technical health. Every website we build includes Google Analytics set up and connected. Every price is on our pricing page.