
Quick answer
Before spending £99 on a speed fix, know why the tools disagree. Each tests from a different place, on a different simulated device and connection, and PageSpeed Insights adds real-visitor data from Chrome users. Judge your site on that field data where it exists, not on any single lab score.
It is a common frustration: GTmetrix gives your site a healthy grade, PageSpeed Insights gives it a worrying mobile score, and running either one again gives a different number. None of them is broken. They are measuring different things in different conditions. This guide explains why the scores differ, which numbers actually matter for visitors and Google, and how to test fairly.
Why two tools give two answers
A speed test is a simulation. A tool loads your page once, in one place, on one pretend device over one pretend connection, and times what happens. Change any of those conditions and the result changes. PageSpeed Insights and GTmetrix make different choices about all of them, so their scores are not comparable, in the same way that a car’s fuel economy in a lab and on the M6 in traffic are not comparable.
Both tools build on Google’s open-source Lighthouse engine for their lab tests, but they run it with different settings and present the results differently. And PageSpeed Insights adds a second, completely different kind of data alongside its lab test: measurements from real people visiting your site.
What each tool actually measures
| PageSpeed Insights | GTmetrix | |
|---|---|---|
| Made by | An independent company | |
| Lab test engine | Lighthouse | Lighthouse-based, with its own presentation |
| Simulated device | Mobile and desktop, both shown | Depends on the test settings you choose |
| Test location | Google data centres | The test server location in its settings |
| Real-visitor data | Yes, from the Chrome User Experience Report, when the site has enough traffic | Built around lab tests |
| Headline number | Performance score out of 100 | Its own grade plus Lighthouse-style metrics |
| Best used for | Seeing what Google sees, including real users | Detailed waterfall charts for debugging |
Google’s page About PageSpeed Insights explains that its mobile lab test simulates a mid-tier phone on a mobile network, and that tests run in Google data centres in North America, Europe or Asia. A test that simulates a fast desktop on a wired connection will naturally score much higher than one simulating a mid-range phone on mobile data. That single difference explains most of the “why is my mobile score so low” questions.
Lab data vs field data
This is the most important distinction in website speed, and the reason PageSpeed Insights shows two sections.
- Lab data is the simulated test: one load, controlled conditions. It is useful for finding problems and checking whether a fix helped.
- Field data is collected from real Chrome users visiting your site over the previous 28 days. It reflects real phones, real connections and real behaviour.
Google’s web.dev article on why lab and field data can be different gives several reasons the two disagree. Real visitors often have parts of your site cached from a previous visit, while lab tests start with an empty cache. Real visitors use different screen sizes, so the largest element on screen may differ. And real behaviour, such as when people tap and scroll, affects responsiveness and layout shift in ways a lab test cannot predict.
When the two disagree, the field data is the closer picture of what your visitors actually experience. Small sites with little traffic may not have field data at all, in which case lab data is all you have.
Why the same tool gives a different score each time
Run PageSpeed Insights twice in a row and the score can move by several points without anything changing on your site. Google’s guide to Lighthouse performance scoring lists common causes, including internet routing changes, A/B tests, ads, testing on different devices, browser extensions and antivirus software. It recommends thinking of performance as a spread of scores rather than one number.
In practice, run a test three times and look at the middle result. Do not celebrate or panic over a single run.
How the performance score is built
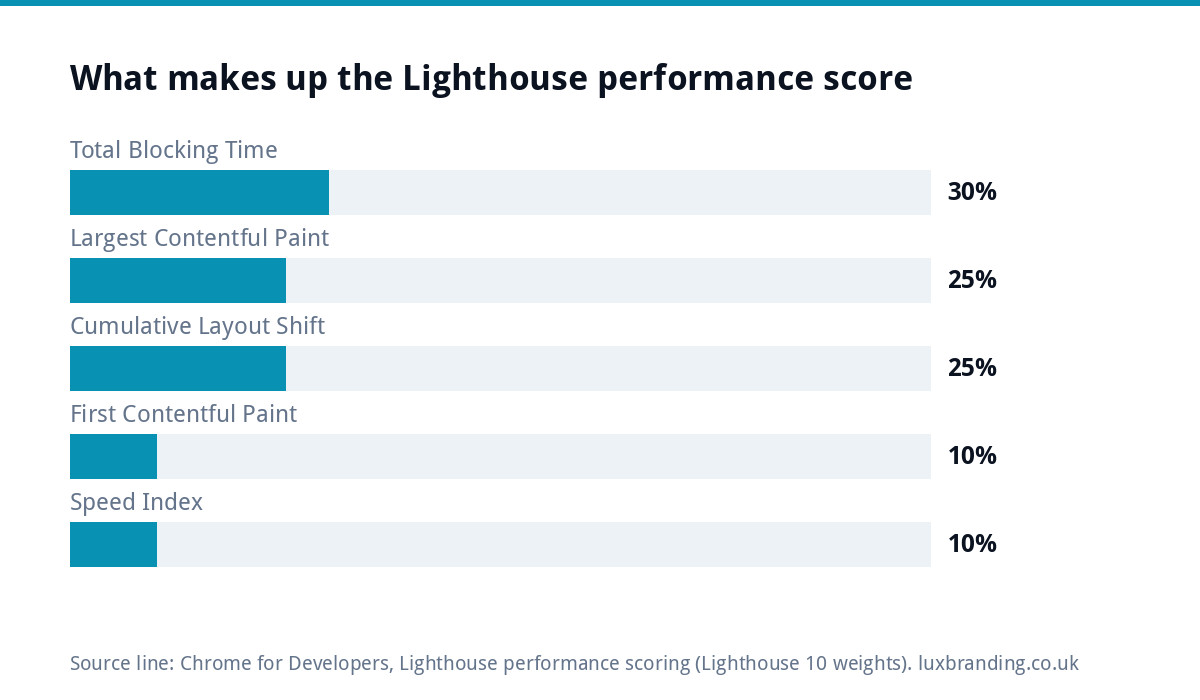
The score out of 100 is a weighted blend of five lab measurements. Under Lighthouse 10, as set out in Google’s scoring guide, the weights are:
| Metric | What it measures | Weight |
|---|---|---|
| Total Blocking Time | How long the page is too busy to respond | 30% |
| Largest Contentful Paint | When the main content appears | 25% |
| Cumulative Layout Shift | How much the layout jumps while loading | 25% |
| First Contentful Paint | When anything first appears | 10% |
| Speed Index | How quickly the visible page fills in | 10% |
That is why a site can feel quick yet score poorly: heavy scripts that block the page for a moment carry the largest weight, even if the content appears fast.
Which number should you trust?
If your site has field data in PageSpeed Insights, focus on the Core Web Vitals assessment at the top rather than the score below it. Google’s Web Vitals guidance sets three targets, measured at the 75th percentile of page loads: Largest Contentful Paint within 2.5 seconds, Interaction to Next Paint of 200 milliseconds or less, and Cumulative Layout Shift of 0.1 or less.
A site that passes those for real visitors is in good shape, even if a lab score is in the 70s. A site with a lab score of 95 but failing field data has a real problem the lab is not seeing. If there is no field data, use the mobile lab score as a guide and focus on the individual metrics rather than the headline number.
Where GTmetrix earns its place
None of this makes GTmetrix less useful. Its strength is diagnosis rather than judgement. The waterfall chart shows every file your page loads, in order, with how long each one took. That makes it easy to spot the oversized hero image, the chat widget that loads a dozen scripts, or the font file that holds everything up.
A sensible way to use the two tools together:
- PageSpeed Insights to answer “is there a problem for real visitors?”, using the field data where it exists.
- GTmetrix to answer “what exactly is slow?”, using the waterfall to find the heavy files.
- The same tool, before and after to answer “did the fix work?”
If your site has too little traffic for PageSpeed Insights to show field data for a single page, it may still show an origin summary for the whole site. Google Search Console’s Core Web Vitals report groups pages that share similar problems, which helps on sites with many similar pages, such as an online shop.
How to test fairly
- Use the same tool each time when comparing before and after a change.
- Test mobile first. Most small business visitors are on phones.
- Run three tests and take the middle result.
- Test key pages, not just the homepage: your main service page and contact page matter as much.
- Use an incognito window if testing in your own browser, so extensions do not skew results.
- Write the results down with the date, so you can see trends rather than single numbers.
What usually fixes a slow small business site
Whatever the tool, the same causes turn up again and again on small business websites.
- Oversized images, especially the hero image, uploaded straight from a camera or phone.
- Too many plugins loading scripts on every page, including ones no longer used.
- Page builders adding layers of extra code around every element.
- Third-party widgets such as chat tools, review carousels and social feeds.
- Slow or overloaded hosting, which delays everything before the page even starts.
Our guide to website speed for small businesses covers these fixes in more depth, and our guide to website hosting costs explains what better hosting involves.
When the score does not matter
A perfect 100 is not the goal. Speed matters because slow pages lose visitors and enquiries, and because Google uses real-user experience as one of many signals. Once your Core Web Vitals pass and the site feels quick on a phone, chasing the last few points rarely changes anything for the business. Content, local visibility and a clear call to action will do more.
Getting help
If your site is failing Core Web Vitals, our website speed optimisation is £99. If the hosting itself is the bottleneck, our website management and hosting is £20 a month with UK hosting, SSL, daily backups, security monitoring and automatic updates. And if the site is built on a heavy theme that cannot be rescued, a hand-coded custom WordPress website is £499. Every price is on our pricing page.
Get the UK Website Project Brief Template (free)
A two-page template for briefing any UK web designer: sitemap, integrations, audience and deliverables. Cuts revision rounds in half.
No spam. UK GDPR compliant. We only use your email to send this resource, unless you tick the box to hear from us.
Frequently asked questions
Why is my PageSpeed Insights score lower than GTmetrix? +
Usually because PageSpeed Insights tests mobile by simulating a mid-tier phone on a mobile network, while other tools may test a desktop on a faster connection by default. The test location and settings differ too. The scores are not comparable; compare each tool only with itself over time.
Which speed test should I trust? +
If your site has field data in PageSpeed Insights, trust the Core Web Vitals assessment, because it reflects real visitors over the previous 28 days. Without field data, use the mobile lab results as a guide and focus on individual metrics such as Largest Contentful Paint rather than the headline score.
Why does my speed score change every time I test? +
Lab tests vary from run to run because of network routing, server load, ads, A/B tests and the testing machine itself. Google recommends thinking of performance as a spread of scores. Run three tests and take the middle result rather than reacting to one.
What is a good PageSpeed score for a small business? +
Aim to pass the Core Web Vitals for real visitors: Largest Contentful Paint within 2.5 seconds, Interaction to Next Paint of 200 milliseconds or less and layout shift of 0.1 or less. A site that passes those is in good shape even if the lab score is not near 100.
How much does Luxbranding charge to speed up a website? +
Our website speed optimisation is £99. If slow hosting is the cause, website management and hosting is £20 a month with UK hosting, SSL, daily backups and security monitoring. If a heavy theme cannot be rescued, a hand-coded custom WordPress website is £499. All prices are on our pricing page.