Quick answer
A good small business infographic turns one idea, such as a process, a comparison or a few key facts, into a single clear visual. Keep it to one message and three to seven points, use your brand colours and real figures with sources, and publish a text version alongside it so Google and screen-reader users get the same information.
Infographics get shared, saved and printed in a way that paragraphs rarely do. A plumber’s “what happens on a boiler service” graphic, a bakery’s “how our sourdough is made” timeline or an accountant’s “key tax dates” chart can all earn attention long after a standard post is forgotten. This guide covers the types that suit small businesses, a seven-step process for designing one, the chart rules that keep data honest and how to make infographics work for search and accessibility.
Types of infographic that suit small businesses
| Type | What it shows | Small business example |
|---|---|---|
| Process or how-to | Steps in order | What happens during a kitchen fit, week by week |
| Comparison | Two or more options side by side | Combi, system or regular boiler |
| Checklist | Things to do or check | Ten checks before you book a removal firm |
| Timeline | Events over time | The history of a family business since it opened |
| Key facts or statistics | A few numbers with context | Results from your own customer survey, with dates |
| Map | Where things happen | The towns and villages you cover |
Process, comparison and checklist infographics are usually the easiest win for a service business, because they answer the questions customers already ask on the phone.
When an infographic is worth making
An infographic earns its design time when:
- The same question comes up again and again from customers
- The answer has a clear structure: steps, options or a handful of facts
- It will be used in several places, such as your website, social media, quotes and printed leaflets
- You have real information to share, not padding
It is not worth it when the content is a single fact, when the information changes every month, or when the “data” would have to be invented to fill the space. A short paragraph or a simple table does those jobs better.
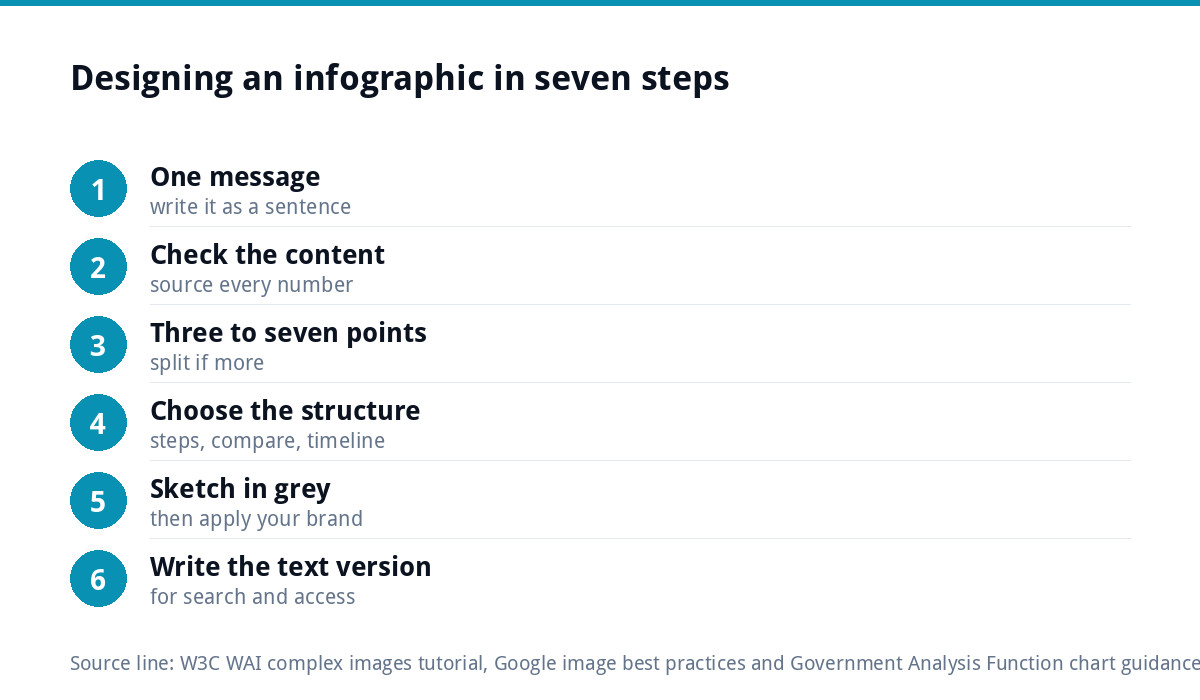
Designing an infographic in seven steps
- Decide the one message. Write it as a sentence: “A boiler service takes about an hour and covers seven checks.”
- Gather and check the content. Collect the steps, options or figures, and note where every number comes from.
- Cut to three to seven points. More than that and people stop reading; split it into a series instead.
- Choose the structure. Steps run top to bottom, comparisons sit side by side, timelines run in date order.
- Sketch it in grey first. Agree the order and hierarchy before adding colour or icons.
- Apply your brand. Your colours, fonts and logo, with one accent colour for the most important point.
- Write the text version. A short summary and the full content in text for the page it sits on.
Worked example: a boiler service infographic
Here is how the seven steps play out for a heating engineer who keeps being asked “what do you actually do on a service?”
- Message: “What happens during your annual boiler service.”
- Content: the engineer lists the checks they actually carry out, in the order they do them, and confirms the wording with their own paperwork.
- Points: six checks, each with a two or three word label and a simple icon.
- Structure: a numbered top-to-bottom process, ending with “what you receive afterwards”.
- Brand: the van’s navy and orange, the logo at the bottom, one accent colour for the safety checks.
- Text version: a service page section that lists the same six checks in full sentences.
The finished graphic goes on the service page, becomes a six-slide carousel for social media, is printed on the back of a service reminder card and is attached to booking confirmation emails. One afternoon of planning produces material for a year.
Keeping charts honest
If your infographic includes charts, the UK Government Analysis Function’s guidance on data visualisation charts is an excellent free rulebook. Its key points for small businesses:
- Choose the chart for the story: line charts for change over time, bar charts for ranking and size.
- Do not break the axis on a bar chart, because it distorts the proportions between bars.
- Avoid 3D shapes, which make values harder to read.
- Use pie charts sparingly: only with five categories or fewer and one clearly dominant category.
- Give each chart a headline title that states the main message.
- Check colours have enough contrast and do not rely on colour alone to match labels to data.
Above all, never invent figures. If you quote a statistic, name the source and the date. If the numbers are your own, say so and say how they were collected.
Design rules that make infographics readable
- One clear reading path, usually top to bottom, with numbered steps where order matters.
- Large headings and short labels. If a section needs a paragraph, it belongs in the text version.
- Consistent icons in one style and one line weight.
- Plenty of space between sections so it does not feel crowded on a phone.
- Your logo and web address at the bottom, small, so shared copies lead back to you.
- A limited palette: your brand colours plus a neutral, with one accent for emphasis.
Making infographics work for search and accessibility
An infographic is an image, which means search engines and screen readers cannot read the words inside it unless you give them a text version. The W3C’s tutorial on complex images says images such as charts, graphs and diagrams need a two-part text alternative: a short description that identifies the image, and a long description that gives the essential information in text. It also advises making long descriptions available to everyone, as part of the main content.
Google’s image best practices point the same way. Google extracts information about an image from the page content, including captions, so place the infographic near relevant text. Write useful alt text without stuffing it with keywords, and use short, descriptive file names such as boiler-service-checklist.png rather than IMG00023.png.
In practice, publish each infographic in a blog post or service page with a short introduction, the image with descriptive alt text, and the full content written out below it. The written version is what most often gets found in search; the graphic is what gets shared.
One design, many uses
Plan the infographic so it can be cut into versions for each channel:
| Where | Format | Tip |
|---|---|---|
| Blog or service page | Full tall version | With the text version underneath |
| Instagram or Facebook | A carousel, one point per slide | Check each platform’s current recommended sizes |
| A carousel or a single summary graphic | Lead with the headline message | |
| Printed leaflet or poster | Reworked for print in CMYK | Screen graphics usually need rebuilding for print |
| Quotes and emails | A small summary image | Link to the full page |
For print, a screen graphic usually needs reworking with print-ready files; our guide to poster design covers sizes and set-up, and our Leaflet and Flyer Design at £89 includes a print-ready CMYK PDF.
Keep it on brand
Infographics travel. People screenshot them, share them and print them, often without the post they came from. If the colours, fonts and logo match the rest of your business, every share builds recognition. If they do not, it could be anyone’s. Our guide to fixing a brand that looks inconsistent everywhere covers how to line things up, and if your colours and fonts are not yet defined, our Brand Identity Design at £299 sets them once for every graphic you make.
Common infographic mistakes
- Too much text, turning the graphic into a poster nobody reads
- Invented or unsourced statistics
- Tiny labels that cannot be read on a phone
- No text version, so search engines and screen readers get nothing
- Decorative charts in 3D or with broken axes
- Off-brand colours and fonts picked from a free template
Getting infographics designed
If you want a set of branded templates you can update yourself, our Social Media Design starts from £79, with on-brand templates editable in Canva and sized for each platform. If you want the writing done as well, our content marketing and blog writing service covers the written side, including the blog posts your infographics sit in. All our prices are on the pricing page.
Get the UK SEO DIY Audit Checklist (free)
A 32-point checklist UK SMEs can run against their own website in an afternoon. Surfaces the quick wins before paying for a paid audit.
No spam. UK GDPR compliant. We only use your email to send this resource, unless you tick the box to hear from us.
Frequently asked questions
What makes a good infographic for a small business? +
One clear message, three to seven points, a single reading path, your brand colours and real information with sources. The best ones answer a question customers already ask, such as what happens during a service or how two options compare. Publish a text version alongside it so search engines and screen readers get the content.
Are infographics good for SEO? +
They can help, but mainly through the page around them. Google extracts information about images from the page content, including captions, and recommends useful alt text and descriptive file names. Search engines cannot read words inside the image, so publish the full content as text below the graphic. The text gets found; the graphic gets shared.
How many points should an infographic have? +
Three to seven is a good range for a small business infographic. Fewer than three rarely needs a graphic, and more than seven usually becomes too crowded to read on a phone. If you have more to say, split the content into a series of graphics or a carousel with one point per slide.
What chart mistakes should I avoid? +
The Government Analysis Function advises against breaking the axis on bar charts, using 3D shapes and using pie charts for more than five categories. Give each chart a headline title stating its message, check colour contrast and do not rely on colour alone to match labels to data. Never invent figures; always name your source.
Can Luxbranding design infographics for us? +
Yes. Our Social Media Design starts from £79, with on-brand templates editable in Canva and sized for each platform, which suits infographic carousels you can update yourself. For printed versions, our Leaflet and Flyer Design is £89 with a print-ready CMYK PDF. All prices are on our pricing page.